Analyzing the Slab
-
Select either:
in the Main Navigator pane.
or
The Analyze / Design tool in the Standard toolbar.
The progress of the analysis process is displayed in the Status Bar along with the steps being performed by the program in the Design Progress Report of the Output pane.
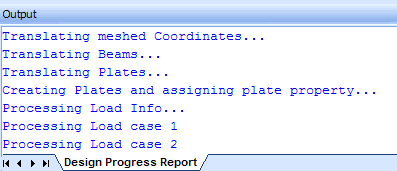
The analysis engine opens to display the progress of the finite element analysis.

Once the analysis process is complete, the deformed shape of the slab is displayed.

- (Optional)
If the slab’s deformed shape is not apparent in your graphics display, you may need to change the scaling values. Click on the toolbar for changing scale which will bring up Scale Setup page in data area pane.
 Note: By default the deformed plates showing the node displacements appear in the graphics display window.
-
Under the Result Scales category, decrease the Displacement value to increase the amount of deflection shown.
Tip: Why do you decrease it to increase the deflection? The Displacement value in the dialog box is the actual displacement of the structure per unit distance on the graphic diagram. Therefore, if you reduce the amount of actual structural deflection required to display a unit distance of deflection on the diagram, you will see a larger apparent displacement on the diagram.After a successful analysis, the program will add several tables in the output pane below.
-
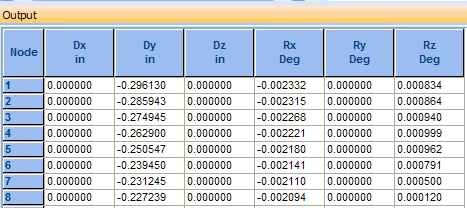
Click on the Displacement tab to view nodal displacement for current selected load case.
This table lists the node displacement for the three translational and three rotational degrees of freedom.
-
Select the Disp Summary tab to view node displacement summary for all six degrees of freedom among all load cases.
Note: Maximum positive displacement in Y direction is 0.049418 in and maximum negative displacement is .792751 in.

-
Click on the ‘Support Reactions’ tab to view soil pressure for the current load case. To view the maximum reaction among all load cases please click on Reaction Summary tab.

-
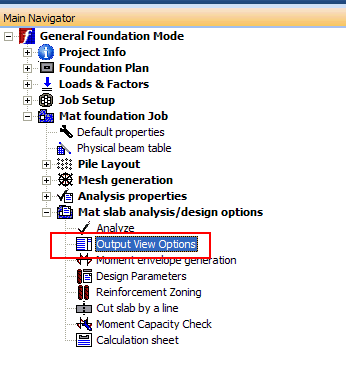
To view soil pressure contour, please click on the Output View Options leaf under Mat slab design options group in main navigator pane.
The Output View Options form opens in the Data pane.
-
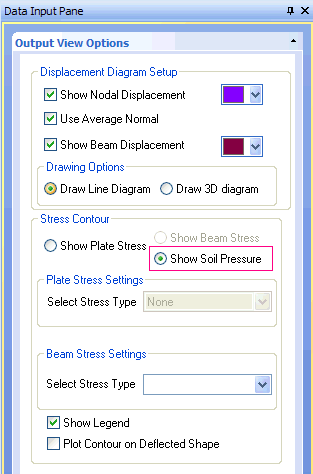
Select the Show Soil Pressure option to view the soil pressure contour in the View window.
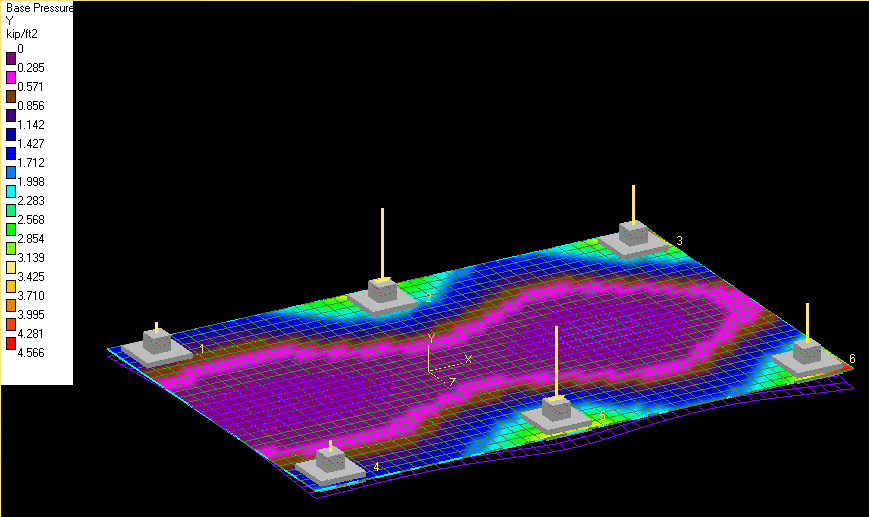
A soil pressure legend will be displayed at the left of the view pane along with the soil pressure contour. Please note, the maximum soil pressure for load case 1 is 4.556 kip/ft2. Also, minimum soil pressure is 0.0 which means that some part of the mat has lost contact with the soil and the program has distributed the pressure of that portion to the rest of the mat slab.
-
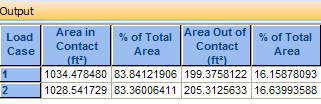
We can easily verify the slab’s loss of contact with the soil by reviewing Contact Area table. Please note for both load cases more than 80% of total area is in contact with the soil.
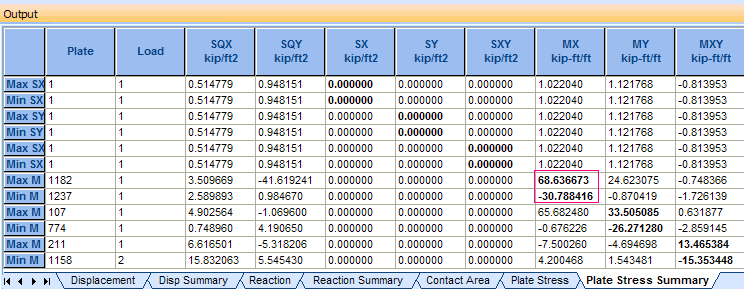
To review plates stresses please click on the Plate Stress and Plate Stress Summary pages. Please note that the stress summary page displays a maximum value 68.636 kip-ft/ft. Please note that all plate stress values are based on plate local axis system.
-
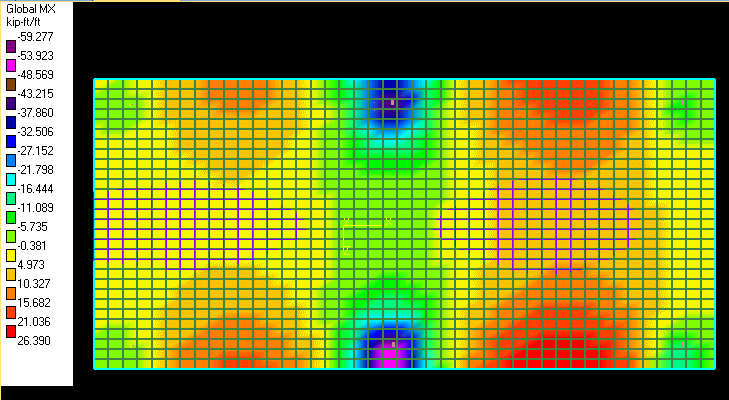
To view plate stress contours please click on the Output View Options leaf under Mat slab design options group
A form will appear at data area pane. Please select Show Plate Stress radio button and then choose Global Mx stress type.

The screen will look like the following figure. Please note that this contour is based on the global X axis.